如何收集 AdGuard 日志记录
本文适用于 Windows 版的 AdGuard,它是一种多功能广告拦截器,可在系统级别保护用户的设备。 To see how it works, download the AdGuard app.
Data and files provided in logs are processed in accordance with the AdGuard Privacy Policy.
To diagnose problems you may encounter while using AdGuard, our support team may need AdGuard log files. These files record errors and other events that occur in the application. This article explains how to change the logging level, collect the logs, and send them to support.
AdGuard for Windows offers two logging levels: Default and Debug. For most troubleshooting, Debug is sufficient, but it may slow down the app.
How to change the logging level
You can change the logging level in either of two ways:
Option 1: In the app
Go to AdGuard settings → Support → Logs, and in the Logging level dropdown select Debug.
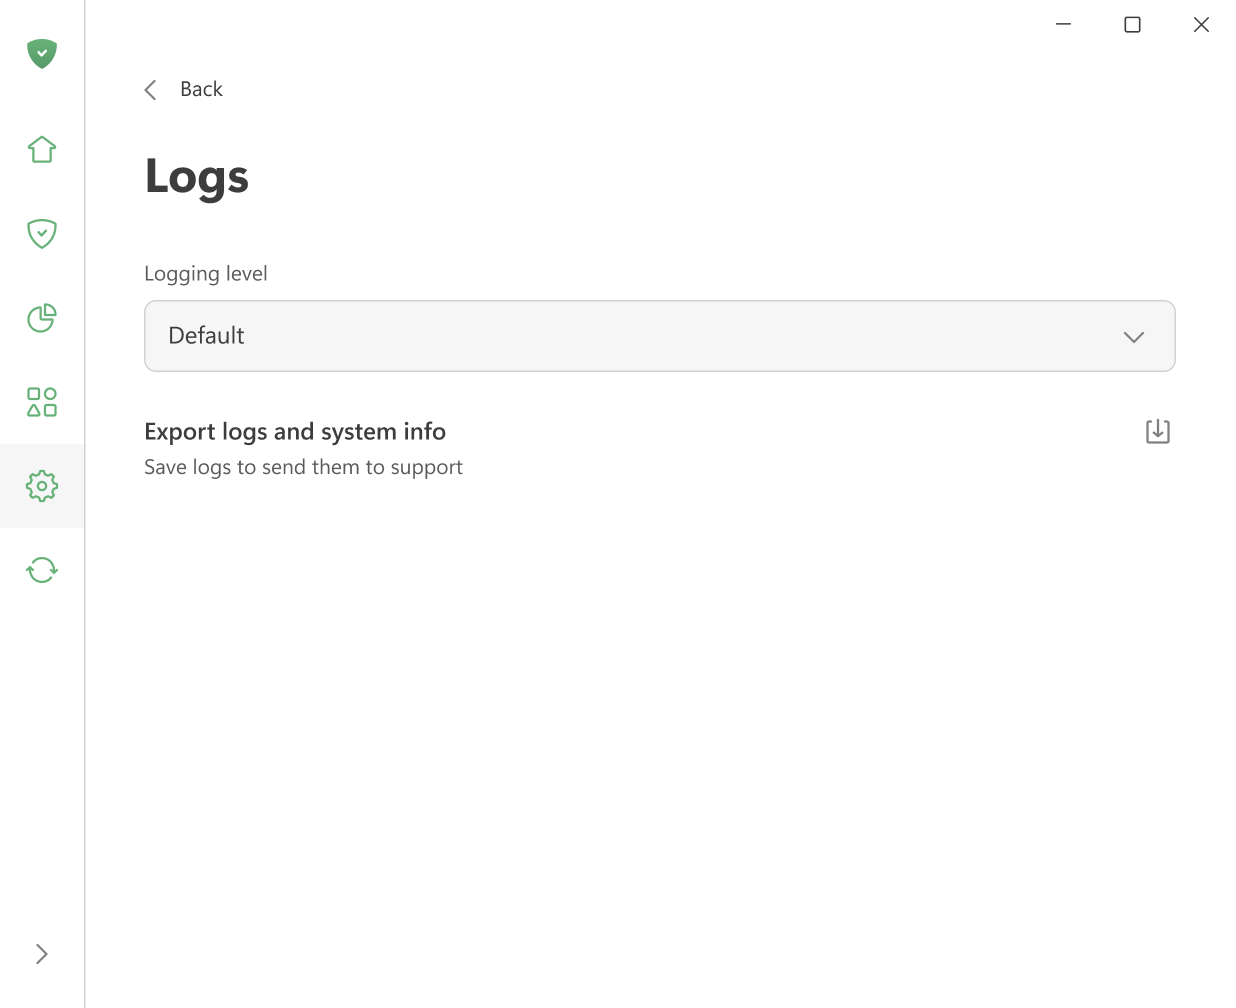
Option 2: From the tray menu
Right-click the AdGuard icon in the system tray, select Advanced → Logging level, and choose Debug.
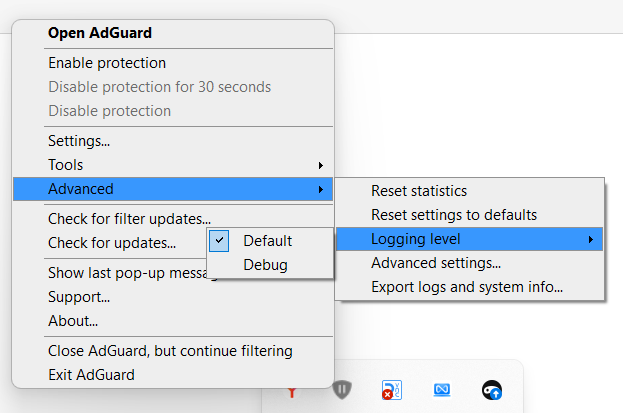
Debug logs
For most issues, debug logs give the support team enough information to identify and fix the problem.
-
Set the logging level to Debug using one of the methods described above.
-
复现问题。 Note the exact time — it will help our support team find the relevant log entries and solve the problem faster.
-
Go to AdGuard settings → Support → Logs, and click Export logs and system info.
Once the export is complete, you’ll see a confirmation message. You can click Show in folder to open the folder where the exported archive with logs and system information was saved.
注意Set the logging level back to Default after exporting the logs. The Debug level slows down the application.
:::
- Send the archive to support@adguard.com, describe the problem, and mention the time you reproduced the issue.
Trace logs
Sometimes the support team may ask you for trace logs. Trace logging captures more detail than debug logging and is only available via command line.
-
Exit AdGuard by right-clicking the AdGuard icon in the tray menu and choosing Exit AdGuard.
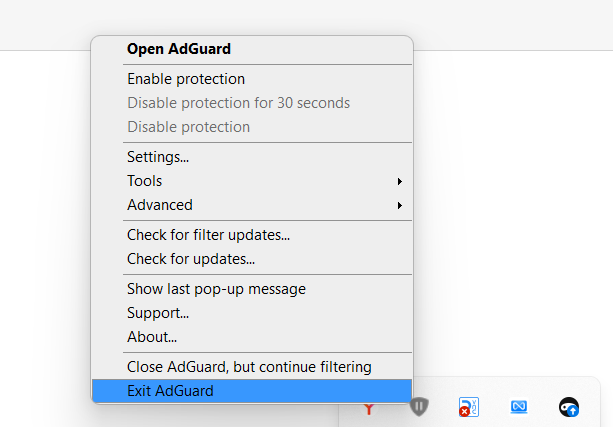
If prompted to keep the service running in the background, make sure to stop it — the service must not be running when you start AdGuard with trace logging.
-
Open the command prompt (type
cmdin the Start menu search). -
Run AdGuard with trace logging enabled:
C:\"Program Files"\Adguard\Adguard.exe /trace -
复现问题。 Note the exact time — it will help our support team find the relevant log entries and solve the problem faster.
-
Export the collected logs: go to Settings → Support → Logs → Export logs and system info.
Don’t worry if the log file is large — we need as much detail as possible to fix your problem.
-
After exporting the trace logs, close AdGuard and restart it normally to return to the default logging level.
Diagnostic report
When contacting support through the form in Settings → Support, you can include a diagnostic report that automatically attaches application logs together with other system information.
The diagnostic report includes:
- Information about the system
- A list of running processes
- Details about AdGuard settings, including enabled filters and installed extensions
- Application logs
To use this option, check the Add diagnostic report checkbox before sending your message.
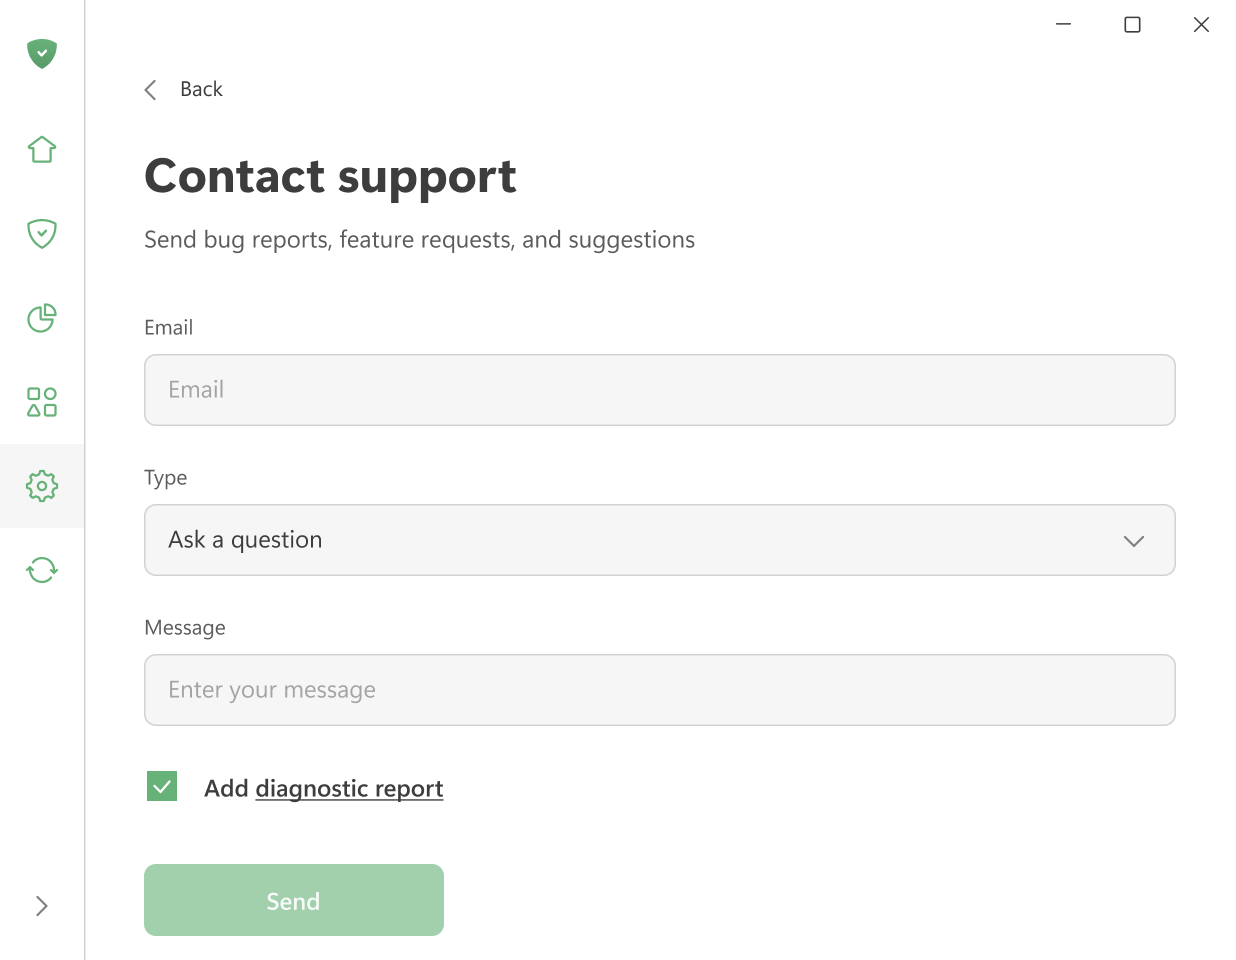
AdGuard 致力于保护用户的个人隐私。我们严格遵守我们的隐私政策 ,不收集任何有关用户的私人信息。请注意:在将您的日志记录发送给客户支持团队之前,请检查文件,因为它会包含您不想分享的附加信息。如果其中包含此类个人信息,我们建议您先将其删除。