AdGuard 로그 수집하는 방법
:::정보
본 문서는 시스템 수준에서 기기를 보호하는 다기능 광고 차단기인 Windows용 AdGuard에 대해 다룹니다. To see how it works, download the AdGuard app.
:::
Data and files provided in logs are processed in accordance with the AdGuard Privacy Policy.
To diagnose problems you may encounter while using AdGuard, our support team may need AdGuard log files. These files record errors and other events that occur in the application. This article explains how to change the logging level, collect the logs, and send them to support.
AdGuard for Windows offers two logging levels: Default and Debug. For most troubleshooting, Debug is sufficient, but it may slow down the app.
How to change the logging level
You can change the logging level in either of two ways:
Option 1: In the app
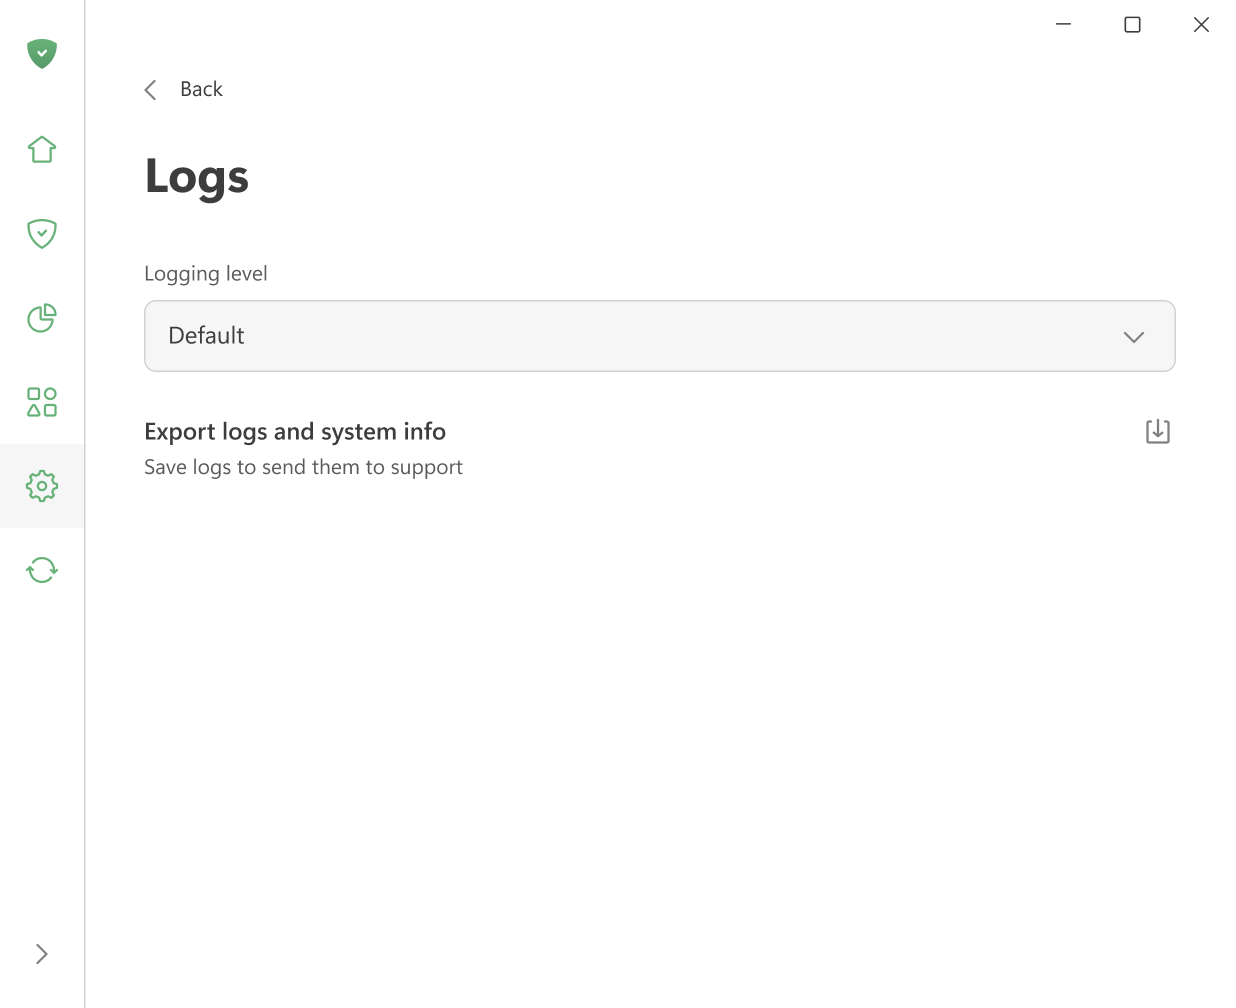
Go to AdGuard settings → Support → Logs, and in the Logging level dropdown select Debug.
Option 2: From the tray menu
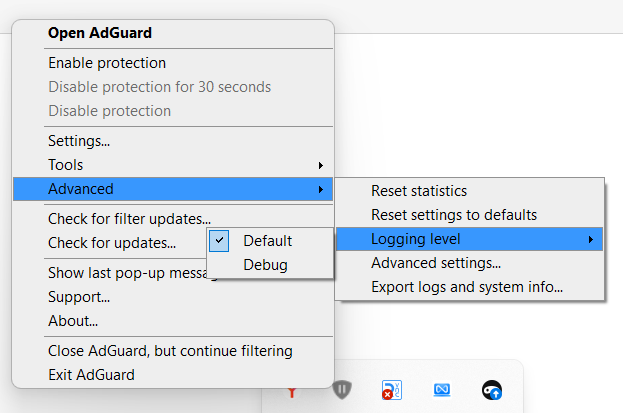
Right-click the AdGuard icon in the system tray, select Advanced → Logging level, and choose Debug.
Debug logs
For most issues, debug logs give the support team enough information to identify and fix the problem.
-
Set the logging level to Debug using one of the methods described above.
-
Reproduce the issue. Note the exact time — it will help our support team find the relevant log entries and solve the problem faster.
-
Go to AdGuard settings → Support → Logs, and click Export logs and system info.
Once the export is complete, you’ll see a confirmation message. You can click Show in folder to open the folder where the exported archive with logs and system information was saved.
noteSet the logging level back to Default after exporting the logs. The Debug level slows down the application.
:::
- Send the archive to support@adguard.com, describe the problem, and mention the time you reproduced the issue.
Trace logs
Sometimes the support team may ask you for trace logs. Trace logging captures more detail than debug logging and is only available via command line.
-
Exit AdGuard by right-clicking the AdGuard icon in the tray menu and choosing Exit AdGuard.
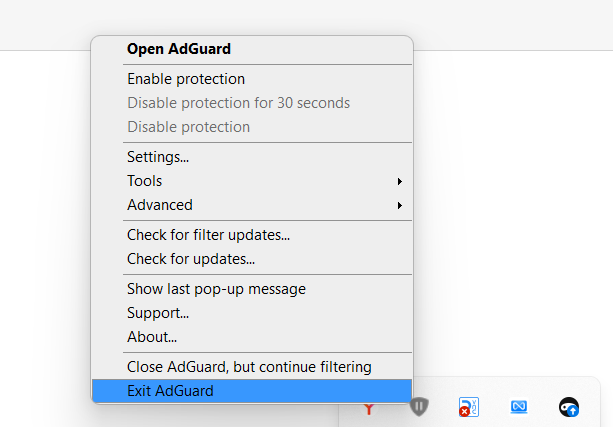
If prompted to keep the service running in the background, make sure to stop it — the service must not be running when you start AdGuard with trace logging.
-
Open the command prompt (type
cmdin the Start menu search). -
Run AdGuard with trace logging enabled:
C:\"Program Files"\Adguard\Adguard.exe /trace -
Reproduce the issue. Note the exact time — it will help our support team find the relevant log entries and solve the problem faster.
-
Export the collected logs: go to Settings → Support → Logs → Export logs and system info.
Don’t worry if the log file is large — we need as much detail as possible to fix your problem.
-
After exporting the trace logs, close AdGuard and restart it normally to return to the default logging level.
Diagnostic report
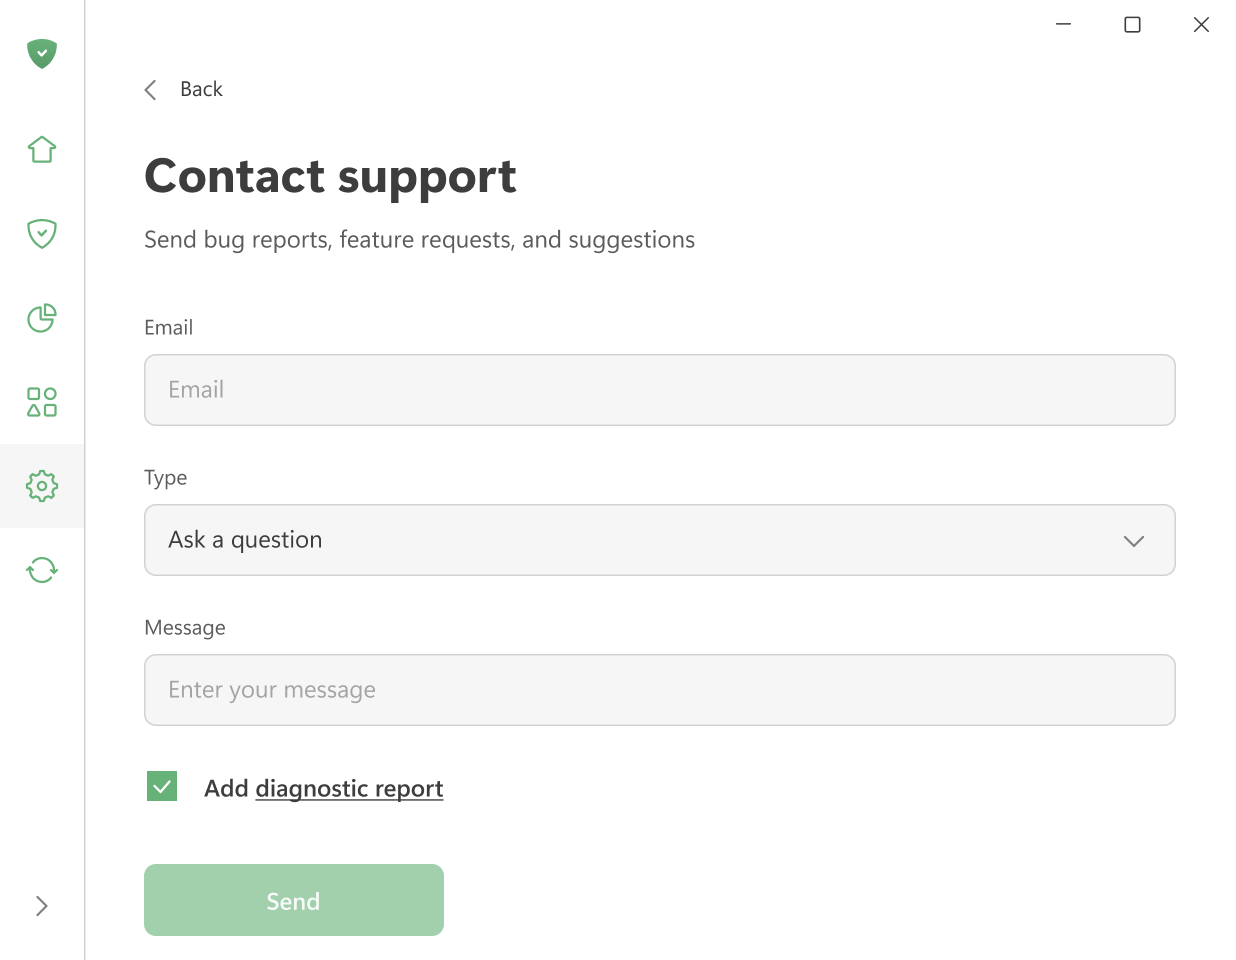
When contacting support through the form in Settings → Support, you can include a diagnostic report that automatically attaches application logs together with other system information.
The diagnostic report includes:
- Information about the system
- A list of running processes
- Details about AdGuard settings, including enabled filters and installed extensions
- Application logs
To use this option, check the Add diagnostic report checkbox before sending your message.
AdGuard는 사용자의 개인정보를 보호하기 위해 최선을 다하고 있습니다. 당사는 개인정보취급방침을 엄격하게 준수하며 사용자에 대한 어떠한 개인 정보도 수집하지 않습니다. 지원팀에 로그를 보내기 전에 파일에 전달하고 싶지 않은 추가 정보가 포함되어 있는지 확인하세요. 이러한 정보가 포함되어 있는 경우, 먼저 삭제하는 것이 좋습니다.